Contact Information
Three International Towers, Level 24, Tower 3, 300 Barangaroo AveSydney, NSW 2000
Australia
Social:
Darren Woolley
Founder & Global CEO
Basic Info
Founded in: 2000
Employees: 20
Founded in: 2000
Employees: 20
TrinityP3
Three International Towers, Level 24, Tower 3, 300 Barangaroo AveSydney, NSW 2000
Australia
Darren Woolley
Founder & Global CEO
How do your agency rates stack up and why?
This post is by Darren Woolley, Founder of TrinityP3. With his background as analytical scientist and creative problem solver, Darren brings unique insights and learnings to the marketing process. He is considered a global thought leader on agency remuneration, search and selection and relationship optimisation.
There is a common misnomer that the rates for agency hours are simply a cost-based calculation. Therefore, for the same resource such as the Group Account Director, the rate charged will always be the same. This is because the approach of calculating the rate is based on the direct salary cost multiplied by the overhead and profit multiple and then divided by the number of annual billable hours per annum to get the hourly rate. We have detailed this approach here. In fact we’ve built and released a business phone app to make these calculations for you.
What we have also found is that for the same agency, resource could be billed out at several different rates to different advertisers. This is not wrong as the agency has the right to negotiate the rates they recover on their staff. The lower rates are usually delivered through reductions in the overhead and profit margin multiple. What is interesting is what the drivers are of the difference from client to client.
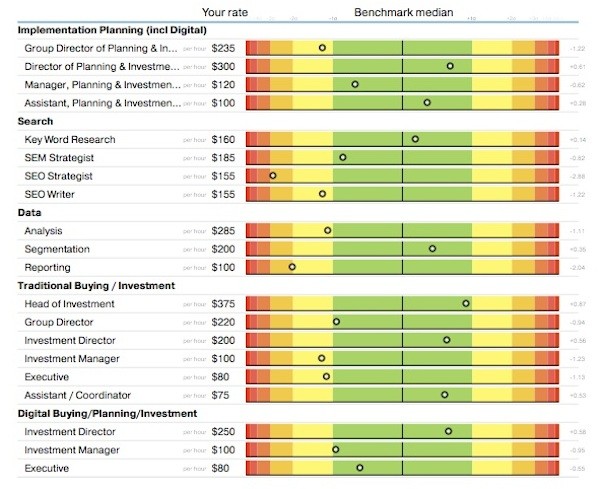
The agency rate benchmark report from the Ad Cost Checker system.
TrinityP3 has been collecting, analysing and benchmarking agency remuneration for more than a decade across all major agency supplier categories including creative, digital, media, design, social and the disciplines within each of these categories including management, account management, strategy, conceptualisation, production and implementation.
In our analysis of the agency rate data some significant trends in agency rate level were identified across the many various types of remuneration arrangements.
Remuneration typeThe first major influence is the type of remuneration. Is the rate part of a retainer, with a guaranteed cash flow, or is it a project-based model with no commitment to volume? The guarantee of payment level and cash-flow will usually lead the agency to offer some type of overall discount in the range of 10% to 15% from the non-retainer or project rate.
In some cases this can be seen in the difference between the rates used to calculate the retainer compared to the rates proposed by the agency for the non-retainer work, especially production related costs.
As a matter of principle, we have the view that if the agency is being paid a significant retainer, then it is disingenuous of the agency to charge the client a loading on the non-retained hourly rates. This does happen and happens quite regularly.
Agency sizeThe agency size, and this is more defined by perception rather than a particular metric such as full time employees, has an interesting impact on the rates that are typically charged. While smaller agencies are usually considered to be more cost effective, this is not always the case. In fact many smaller agencies do not have the economies of scale or the back end efficiencies to maintain or offer lower overheads.
Often the senior management of the agency will have come from some of the larger agencies and will be inclined to recover their salaries at the same levels. This is justified by positioning the senior level involvement as a benefit, but it also sets expectations for the rates the other members of staff are charged.
Agency ownershipThe ownership of the agency also appears to impact the agency hourly rate, with independent agencies being at a lower rate than the larger global network agencies. This is usually around 10% to 15% on a like for like basis and correlates well with the typical network rate of recovery from individual offices to cover regional and global operational costs. These are the fees paid by the individual offices in the agency networks and are calculated as either a percentage or payroll.
Obviously independent agencies do not have these regional and global infrastructure costs for recovery.
Advertiser sizeIt is not just the agencies that impact the rates charged; it is also dependent on the advertiser, as the agency will set their pricing on the particulars of the client. The size of the client and the size of the project provide economy of scale for the agency with the large advertisers and the larger projects leading to significant reductions in agency rates. Interestingly, the larger the agency, either network or independent, the greater the discount in rates from the norm. The level of discount is inclined to be greater from the larger agencies and decrease with the size of the agency. However larger advertisers generally have the negotiation clout that leads to discounts across the board.
Advertiser ownershipIt is interesting to note that local advertisers are inclined to get better rates with both independent and network agencies, compared to their global or multinational corporation (MNC) advertiser counterparts. This is often reflected in the complaints of many marketers working for global brands about the rates they are paying in their local markets.
Local advertisers appear to leverage their knowledge of the local markets to negotiate rate reductions from across the board. In this situation, rate reductions are achieved wall to wall, but again the larger the agency the larger the discounts.
Advertiser alignmentWhere global or multinational marketers are particularly successful is where there is a global alignment to a network agency. This is because the scale of a global agreement, the role of procurement, and the negotiation approach can deliver the most significant discounts in global network agency rates, compared to other advertisers.
Non-contributing factorsThere are a number of factors that some advertisers believe impact the rate they pay including the category they are advertising, the level of complexity of the project or brief, or the length of the relationship, but we have found no evidence in the rate analysis to suggest that any of these have a major influence on the agency rate.
If anything these are inclined to drive up the number of hours charged, rather than impacting the rate. The number of hours required to deliver a particular outcome is a very different type of benchmark that we use to analyse the efficiency of the current agency relationship.
Check your agency rates against marketUsing the data we have collected and continue to collect, we have developed an online application that allows agencies, procurement and advertisers to check the rates against the market based on the influences and trends we have defined here.
The system is called Ad Cost Checker and is available online. You can see the various benchmarks we have developed here or download a typical benchmarking report here.
The Ad Cost Checker provides you with an independent source of validation to check agency rates.
So how do your rates stack up?